|
Forums59
Topics1,038,881
Posts13,954,738
Members144,181
| |
Most Online39,925
Dec 30th, 2023
|
|
 Re: Graphing
[Re: WillieKetchum]
#11216182
11/10/15 01:51 PM Re: Graphing
[Re: WillieKetchum]
#11216182
11/10/15 01:51 PM
|
Joined: Oct 2013
Posts: 2,576
UTDmiller
 OP
OP
Extreme Angler
|
|
OP
Extreme Angler
Joined: Oct 2013
Posts: 2,576 |
These are tires. 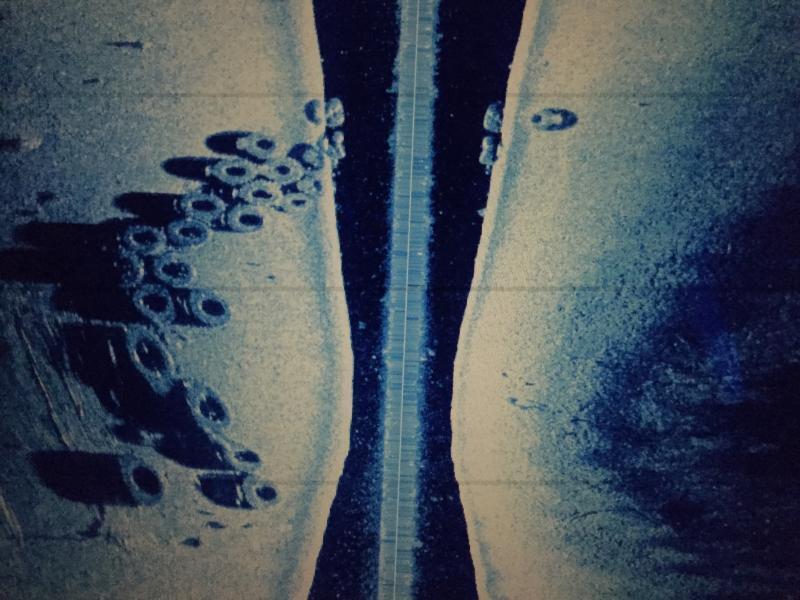 Clearly.
John Miller
|
|
|
Re: Graphing
[Re: UTDmiller]
#11216196
11/10/15 01:55 PM
|
Joined: Nov 2014
Posts: 23,362
SteezMacQueen

TFF Guru
|
|
TFF Guru
Joined: Nov 2014
Posts: 23,362 |
These are tires. Clearly. maybe on that graph. Not on mine. Lol. I have never, EVER, got my graphs to look as good as they look when in demo mode. Haha. Sometimes, in big tourneys, I'll leave them in demo mode so it looks like I have [censored] that works! Haha. Just kidding.
Eat. Sleep. Fish.
|
|
|
Re: Graphing
[Re: UTDmiller]
#11216197
11/10/15 01:55 PM
|
Joined: Oct 2013
Posts: 2,576
UTDmiller
OP
Extreme Angler
|
|
OP
Extreme Angler
Joined: Oct 2013
Posts: 2,576 |
Yeah I have done the web search and watched some, some were helpful and others not so much.
I have found someone that will take me out and teach me what they know.
Thanks for the replys everyone, sarcastic or not. Since someone is going to help me out I hope to be able to help someone else out in the future
John Miller
|
|
|
Re: Graphing
[Re: UTDmiller]
#11216527
11/10/15 04:39 PM
|
Joined: Aug 2008
Posts: 631
Mayo
Pro Angler
|
|
Pro Angler
Joined: Aug 2008
Posts: 631 |
You have to be willing to put your time in with them just like anything else. Do as much research as you can between Google and YouTube. If you don't think what's popping up is what you're looking for then try again and use key words. There's a ton of info out there but it was difficult for me to find exactly what I was looking for. After this I took what I learned to the water. I have spent more time graphing than fishing sometimes. Also, don't be afraid to change settings. You can always change it back. Toggle settings back and forth to see differences. The first thing that really helped me identifying what my graph was trying to tell me was finding a palette that fits you. We all see things differently. Try different ones until you find the one that clears up what's going on under the boat.
Practice, practice, practice
Last edited by Mayo; 11/10/15 04:41 PM.
|
|
|
Re: Graphing
[Re: Mayo]
#11216552
11/10/15 04:57 PM
|
Joined: Oct 2013
Posts: 2,576
UTDmiller
OP
Extreme Angler
|
|
OP
Extreme Angler
Joined: Oct 2013
Posts: 2,576 |
You have to be willing to put your time in with them just like anything else. Do as much research as you can between Google and YouTube. If you don't think what's popping up is what you're looking for then try again and use key words. There's a ton of info out there but it was difficult for me to find exactly what I was looking for. After this I took what I learned to the water. I have spent more time graphing than fishing sometimes. Also, don't be afraid to change settings. You can always change it back. Toggle settings back and forth to see differences. The first thing that really helped me identifying what my graph was trying to tell me was finding a palette that fits you. We all see things differently. Try different ones until you find the one that clears up what's going on under the boat.
Practice, practice, practice Thank you for the tips, I found a palette I feel fits me best last time I was out. It was a big help for sure. I will keep researching
John Miller
|
|
|
Re: Graphing
[Re: UTDmiller]
#11216704
11/10/15 06:30 PM
|
Joined: Aug 2008
Posts: 631
Mayo
Pro Angler
|
|
Pro Angler
Joined: Aug 2008
Posts: 631 |
There's more going on here in the tire pic which I'll try and explain if I'm wrong then someone please feel free to correct me. I've only had my graphs since July I believe. Before I get into details here's some basics. The line in the middle is cavitation from your prop. The dark area on each side of this is the water column below you. Then you have the bottom of the lake starting below you then what's further out on both sides of you. Your side imaging transducer shoots down then out. To know the distance of an object to the left or right of you you have to subtract the depth of water you're in from how far the object is shown according to the scale on side imaging. Ever notice when trying to scan a shoreline you don't see it and your're looking out 30' but you're 20' from it and in 20' of water? On my lowarnce the scale is locate at the bottom of the screen. Usually in increments of 10 or 20 feet. Understand the further you scan out the smaller images will be. Also, in shallower water you don't need to scan that far out out but in deeper water you don't want to be to far in. A good rule of thumb is 2 to 3 times the depth. I'm never run over 80' and in the deepest water I fish around here I'm usually at 60'. I'm constantly changing this as I'm graphing and its related to how deep the water is. Two other important things. I always run in 800khz to have the cleanest picture. You may want to try 455khz in shallower water but I'm almost always in 800. The other thing is adjust the contrast as you're scanning. You don't want it to bright or to dark. The sweet spot is where it defines what's below you. You'll need more in deeper water than shallow. You'll notice this as you play with it and this will help get use to the unit. I have no problems with auto either and I keep noise rejection off. I want to see everything below me. So back to the picture... Notice how at the top of the screen the water column is wide in the middle of the screen it's more narrow then at the bottom of the screen it's wide again. This clearly defines a hump. The screen widening shows water getting deeper and narrowing its getting shallow. Also all along the tires you see white dots to a few white lines. These are all fish relating to the cover. The dots are small fish probably bait fish. If you look closely near the bottom of the picture you see a really nice fish. It's a clear white line. You can also in some places their shadows. This tells you they are suspended some. Not directly on the bottom. I can see other cover as well like rocks and limbs. I hope this helps you some. Just make sure to look up every now and then. I've had a few close calls paying to much attention to my graph... 
Last edited by Mayo; 11/10/15 06:41 PM.
|
|
|
Re: Graphing
[Re: Mayo]
#11216739
11/10/15 06:46 PM
|
Joined: Oct 2013
Posts: 2,576
UTDmiller
OP
Extreme Angler
|
|
OP
Extreme Angler
Joined: Oct 2013
Posts: 2,576 |
There's more going on here in the tire pic which I'll try and explain if I'm wrong then someone please feel free to correct me. I've only had my graphs since July I believe. Before I get into details here's some basics. The line in the middle is cavitation from your prop. The dark area on each side of this is the water column below you. Then you have the bottom of the lake starting below you then what's further out on both sides of you. Your side imaging transducer shoots down then out. To know the distance of an object to the left or right of you you have to subtract the depth of water you're in from how far the object is shown according to the scale on side imaging. Ever notice when trying to scan a shoreline you don't see it and your're looking out 30' but you're 20' from it and in 20' of water? On my lowarnce the scale is locate at the bottom of the screen. Usually in increments of 10 or 20 feet. Understand the further you scan out the smaller images will be. Also, in shallower water you don't need to scan that far out out but in deeper water you don't want to be to far in. A good rule of thumb is 2 to 3 times the depth. I'm never run over 80' and in the deepest water I fish around here I'm usually at 60'. I'm constantly changing this as I'm graphing and its related to how deep the water is. Two other important things. I always run in 800khz to have the cleanest picture. You may want to try 455khz in shallower water but I'm almost always in 800. The other thing is adjust the contrast as you're scanning. You don't want it to bright or to dark. The sweet spot is where it defines what's below you. You'll need more in deeper water than shallow. You'll notice this as you play with it and this will help get use to the unit. I have no problems with auto either and I keep noise rejection off. I want to see everything below me. So back to the picture... Notice how at the top of the screen the water column is wide in the middle of the screen it's more narrow then at the bottom of the screen it's wide again. This clearly defines a hump. The screen widening shows water getting deeper and narrowing its getting shallow. Also all along the tires you see white dots to a few white lines. These are all fish relating to the cover. The dots are small fish probably bait fish. If you look closely near the bottom of the picture you see a really nice fish. It's a clear white line. You can also in some places their shadows. This tells you they are suspended some. Not directly on the bottom. I can see other cover as well like rocks and limbs. I hope this helps you some. Just make sure to look up every now and then. I've had a few close calls paying to much attention to my graph... Thank you, I noticed the little white dots over the tires and now see the white lines with shadows below. Info like that is exactly what I was looking for 
John Miller
|
|
|
Re: Graphing
[Re: Mayo]
#11216937
11/10/15 08:29 PM
|
Joined: Jun 2015
Posts: 547
WillieKetchum
Pro Angler
|
|
Pro Angler
Joined: Jun 2015
Posts: 547 |
There's more going on here in the tire pic which I'll try and explain if I'm wrong then someone please feel free to correct me. I've only had my graphs since July I believe. Before I get into details here's some basics. The line in the middle is cavitation from your prop. The dark area on each side of this is the water column below you. Then you have the bottom of the lake starting below you then what's further out on both sides of you. Your side imaging transducer shoots down then out. To know the distance of an object to the left or right of you you have to subtract the depth of water you're in from how far the object is shown according to the scale on side imaging. Ever notice when trying to scan a shoreline you don't see it and your're looking out 30' but you're 20' from it and in 20' of water? On my lowarnce the scale is locate at the bottom of the screen. Usually in increments of 10 or 20 feet. Understand the further you scan out the smaller images will be. Also, in shallower water you don't need to scan that far out out but in deeper water you don't want to be to far in. A good rule of thumb is 2 to 3 times the depth. I'm never run over 80' and in the deepest water I fish around here I'm usually at 60'. I'm constantly changing this as I'm graphing and its related to how deep the water is. Two other important things. I always run in 800khz to have the cleanest picture. You may want to try 455khz in shallower water but I'm almost always in 800. The other thing is adjust the contrast as you're scanning. You don't want it to bright or to dark. The sweet spot is where it defines what's below you. You'll need more in deeper water than shallow. You'll notice this as you play with it and this will help get use to the unit. I have no problems with auto either and I keep noise rejection off. I want to see everything below me. So back to the picture... Notice how at the top of the screen the water column is wide in the middle of the screen it's more narrow then at the bottom of the screen it's wide again. This clearly defines a hump. The screen widening shows water getting deeper and narrowing its getting shallow. Also all along the tires you see white dots to a few white lines. These are all fish relating to the cover. The dots are small fish probably bait fish. If you look closely near the bottom of the picture you see a really nice fish. It's a clear white line. You can also in some places their shadows. This tells you they are suspended some. Not directly on the bottom. I can see other cover as well like rocks and limbs. I hope this helps you some. Just make sure to look up every now and then. I've had a few close calls paying to much attention to my graph... The whole post above is dead on! As someone else stated above, you will need to spend hours and hours on the water just graphing. What helped me the most was graphing places where I knew what was there. Graph around bridges to see the pilings. Graph boat docks and look for their pilings. I'm sure you know where there are some good creeks...graph around those creeks and you'll eventually pick up on what a creek looks like when it's out beside you 30'. Graph road beds...a true road bed will be harder than the bottom around it and will show up a brighter white. The brighter the white, the harder the bottom. I leave my graph set to 60' range unless I'm really trying to cover water them I may go to 80'. When you get over 60' the fine details that we are looking for as bass fishermen get too small. Most importantly, as Mayo said above - don't get wrapped up in watching your graph for long periods of time. That hump or creek bend that you're headed to look at has attracting your attention....guess what...it's likely attracted someone else's attention and they are sitting there fishing it! I promise you'll idle up on someone before you know it! This is a good article by Tom Reddington. http://www.scout.com/outdoors/wired2fish/story/1492858-3-tips-to-get-more-out-of-any-fish-finder
|
|
|
Re: Graphing
[Re: UTDmiller]
#11219659
11/12/15 02:35 AM
|
Joined: Nov 2015
Posts: 26
luke18one
Outdoorsman
|
|
Outdoorsman
Joined: Nov 2015
Posts: 26 |
This guy Slade you speak of. He sounds like the Yoda of Graphs. How much does one of these trips cost to learn the ways of the the "force" we call sonar?
Always pray, and never lose heart. Luke 18:1
I am passionate about 2 things, bass fishing and bass fishing.
|
|
|
Re: Graphing
[Re: UTDmiller]
#11219752
11/12/15 03:14 AM
|
Joined: Jul 2014
Posts: 4,340
Bobby Milam
TFF Team Angler
|
|
TFF Team Angler
Joined: Jul 2014
Posts: 4,340 |
I think it was around 250 for half a day. Better call to make sure though. It was worth every penny. Nice not only being told all the functions but to also have a live person to ask questions to and get answers then shown on the screen. He will probably save you about a years work learning and hours of sorting thru videos of you are starting from scratch. Also, if you never get them adjusted properly, you'll never learn on your own.
|
|
|
Re: Graphing
[Re: UTDmiller]
#11220086
11/12/15 01:17 PM
|
Joined: Jul 2010
Posts: 1,514
engine1129
Extreme Angler
|
|
Extreme Angler
Joined: Jul 2010
Posts: 1,514 |
slade is the man for all your electronics need
|
|
Moderated by banker-always fishing, chickenman, Derek 🐝, Duck_Hunter, Fish Killer, J-2, Jacob, Jons3825, JustWingem, Nocona Brian, Toon-Troller, Uncle Zeek, Weekender1
|